3D and Quantitative Imaging Laboratory
  • Home
  • Education
    • Education
    • Educational Post Feed
  • Research
    • Research
    • Validation Cohort: Acute Uncomplicated Type-B Aortic Dissection
  • Patient Care
    • Patient Care
    • 3D Printing in Medicine
    • 3DQ Lab TRAC Team (Tumor Response)
  • Case Studies
    • Case Studies
    • Innovation Projects
  • Click to open the search input field Click to open the search input field Search
  • Menu Menu

Claudication

A patient experiencing pain, cramping, and fatigue in the lower extremities was referred Radiology and the 3DQ Lab for imaging, assessment, and visualization. Symptoms like these indicate claudication, a condition caused by inadequate blood supply to the muscles. Previously performed imaging analysis of the patient revealed severe peripheral artery disease (PAD), a narrowing and obstruction of the arteries primarily caused by a buildup of fatty plaque. A bilateral aortobifemoral bypass graft surgery had been performed to create alternative blood flow pathways from the aorta to the femoral arteries  to restore blood supply to the lower extremities; but the recurrence of claudication prompted further intervention.

Figure A (Right): Rotational Volume Rendering showing the pelvis (grey), arterial blood flow (red) and calcification of the blood vessels (green). The lack of continuous arterial paths down the legs indicate locations of reduced or blocked blood flow.

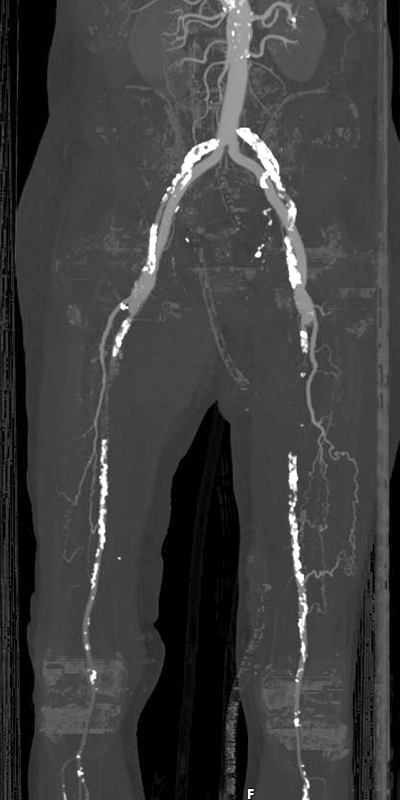
A CT angiogram was acquired to visualize the blood flow in the arteries of the lower extremities. An iodine-based contrast agent injection was used to enhance the visibility of blood vessels for identification of arterial disease.  A Stanford 3DQ Lab Technologist provided “runoff” imaging, an assessment of the arterial system typically ranging from the pelvis to the feet, and used to evaluate the condition of the blood vessels, identify any blockages, and assess overall blood circulation. Maximum Intensity Projection (MIP) and Curved Planar Reformation (CPR) images were created to increase the understanding of blood flow near areas of narrowing and calcification. Learn more about CPRs here: https://3dqlab.stanford.edu/cpr-techniques/

The runoff, visualizations, and images were provided to the involved medical professionals for use in determining the most appropriate treatment options. Some of the images provided to the physicians included:

Figure B: A Maximum Intensity Projection (MIP) image gives a clear picture of the major arteries and shows any calcification, blockages, or narrowing.
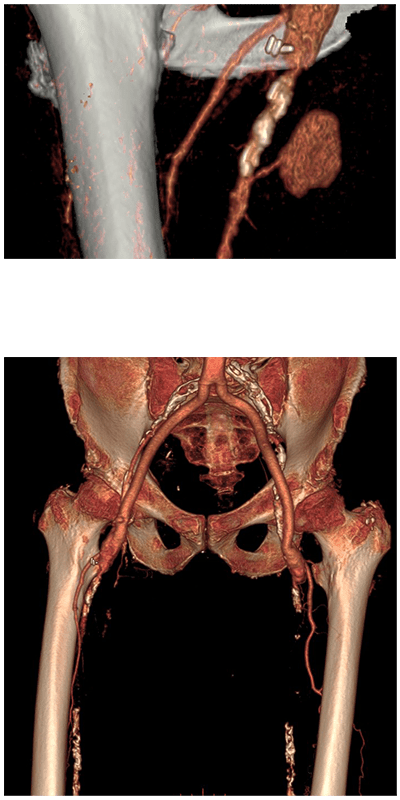
Figure C: 3D visualizations of imaging data show a hematoma located near the right femoral artery, in the context of the bone, iliac and femoral arteries.
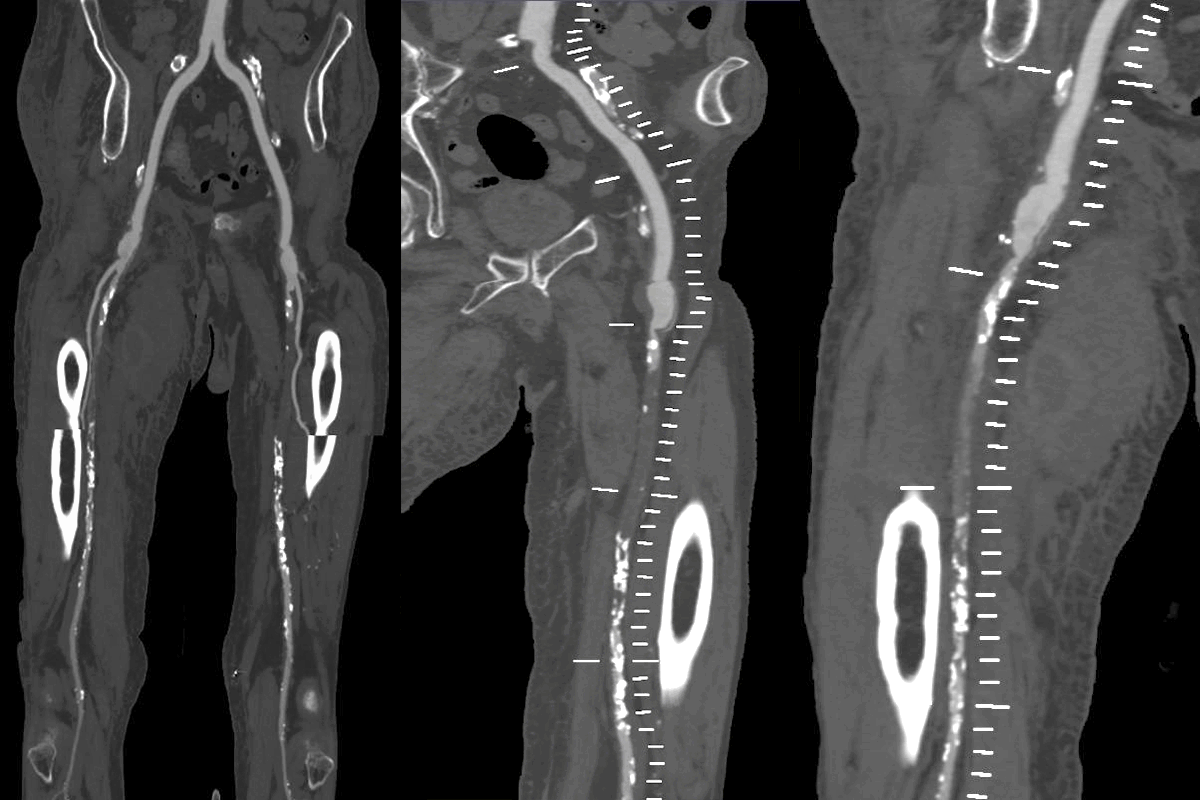
Figure D: A Curved Planar Reformation, showing the arteries as they branch down the lower extremities, was used to visualize the path of blood vessels. Guide lines were added at regular intervals for use in measurement.
Marc Sofilos

Kyle Gifford

Categories

  • Head & Neck
  • Chest
  • Abdomen & Pelvis
  • Upper Extremity
  • Lower Extremity
  • Case of the Month
  • Techniques

3DQ Lab – Grant Building

300 Pasteur Drive
Stanford, CA 94305

(650) 725-8432

Directions to Grant

3DQ Lab – Clark Building

318 Campus Drive
Stanford, CA 94305

(650) 725-6862

Directions to Clark

Learn More About the Lab

  • About Us
  • Meet the Team
Search Search

Copyright © Stanford University

© Copyright - 3D and Quantitative Imaging Laboratory - Enfold Theme by Kriesi
  • Link to LinkedIn
  • Link to Instagram
Link to: Computed Tomography (CT) Link to: Computed Tomography (CT) Computed Tomography (CT) Link to: Longitudinal Analysis Link to: Longitudinal Analysis Longitudinal Analysis
Scroll to top Scroll to top Scroll to top