
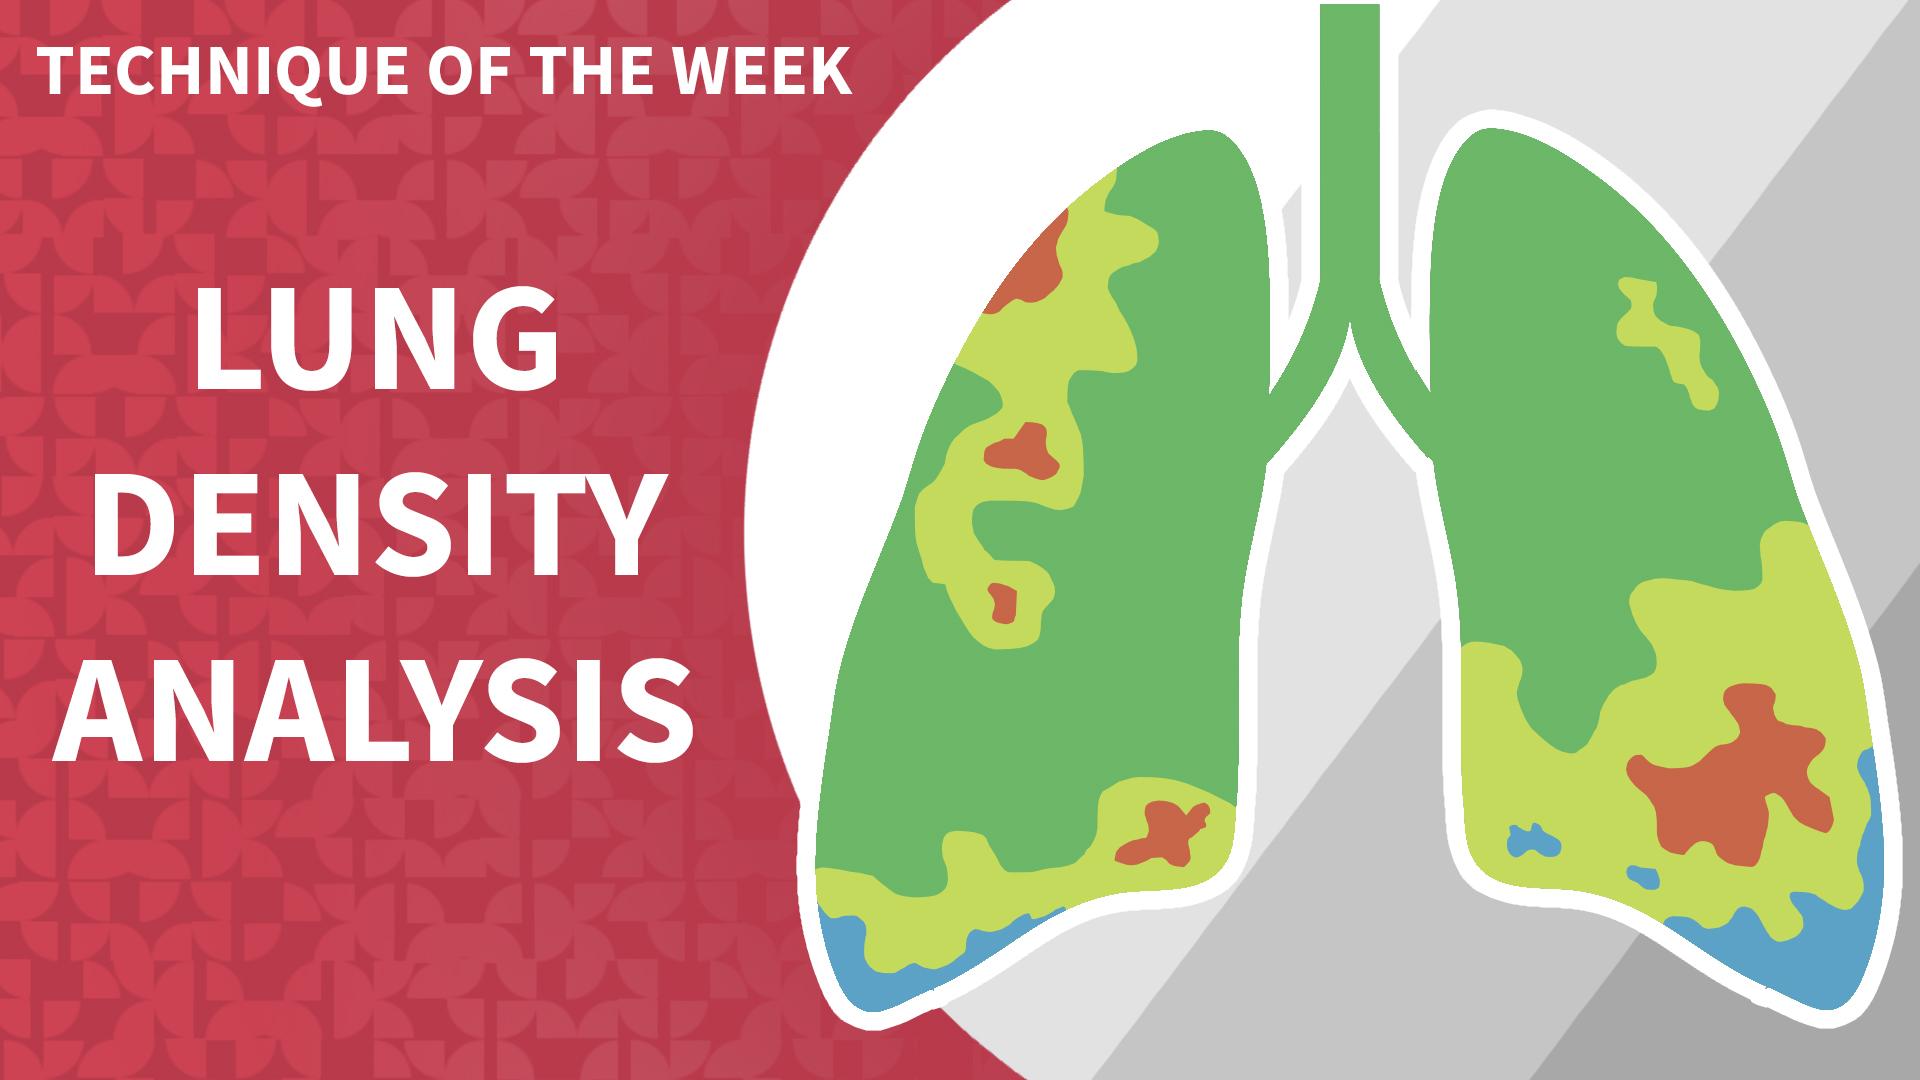
Certain computed tomography (CT) image series can be used to visualize the distribution of air and other substances within the lung tissue. In a CT scan, air-filled spaces like the bronchi and alveoli appear dark (low density), while denser materials like blood vessels, solid tissues, or areas of inflammation appear brighter (higher density).
AI can be utilized to detect changes in Hounsfield Unit (HU) density within the lungs of patients with COPD by employing a combination of image analysis techniques and machine learning. AI algorithms have the capability to quickly provide precise quantitative measurements for these density changes. Enabling quick assessment of the extent, severity, and distribution of abnormal HU values within the lung tissue. The measurements are instrumental in evaluating the progression and severity of COPD in individual patients.
In terms of visualization and reporting, AI systems can generate visual heatmaps or colored overlays on CT images to emphasize areas with abnormal HU density changes, assisting clinical interpretation. Additionally, these systems can produce structured reports that offer quantitative data and visual aids to assist radiologists and pulmonologists in their diagnostic and treatment planning efforts.
Figure A (Right): AI generated heatmap and analysis table illustrating the location and severity of variable density in a patient’s lungs.

AI-generated density reports can be merged with CT images, integrating the quantitative data and visual annotations generated by AI algorithms into a colorized image series. The combined data, along with the corresponding heat-map report (Figure A), is provided to radiologists and pulmonologists by the 3DQ Lab. They utilize this integrated information to evaluate the COPD extent and devise suitable treatment strategies.

Figure B: Original scan that was input into the AI program.

Figure C: Density heatmap that has been fused with the CT scan.

Figure D: Individual lobes of the lung have been identified and fused with the CT scan.

