3D and Quantitative Imaging Laboratory
  • Home
  • Education
    • Education
    • Educational Post Feed
  • Research
    • Research
    • Validation Cohort: Acute Uncomplicated Type-B Aortic Dissection
  • Patient Care
    • Patient Care
    • 3D Printing in Medicine
    • 3DQ Lab TRAC Team (Tumor Response)
  • Case Studies
    • Case Studies
    • Innovation Projects
  • Click to open the search input field Click to open the search input field Search
  • Menu Menu

TRAC Program

Collaborators: Stanford Radiology

To be efficient, immunotherapy and other tumor-directed interventions require consistent tracking of tumor measurements across time. Radiologists need repeatable baseline and follow-up measurements for the same target lesions, documentation of non-target disease, and a standardized way to compare change across multiple examinations. Without a consistent longitudinal measurement workflow, response assessment becomes more variable and time-consuming.

Stanford radiologists identified that these measurements were not being tracked or managed in a standardized way across timepoints and requested a formal program to address the gap. They approached the Stanford 3DQ Lab because the lab was already providing standardized measurements and consistent imaging outputs in other clinical workflows, and they asked the lab to evaluate software options that could support longitudinal tracking and reporting.
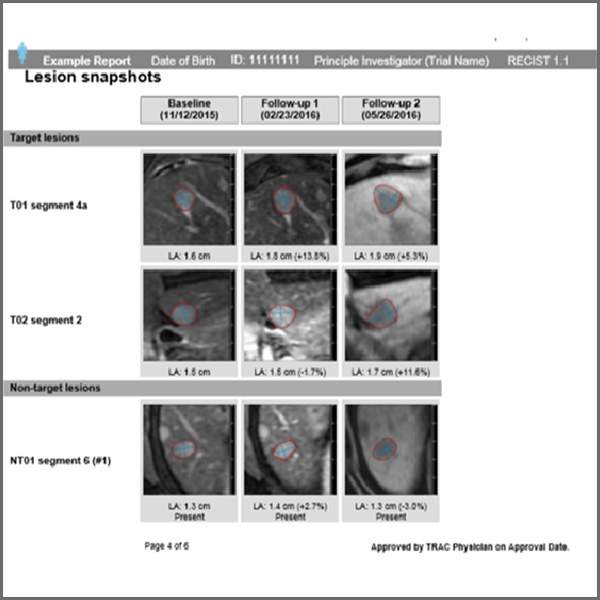
Figure A. TRAC report lesion snapshot gallery showing baseline and follow-up images for target and non-target lesions with outlined segmentations and recorded measurements.
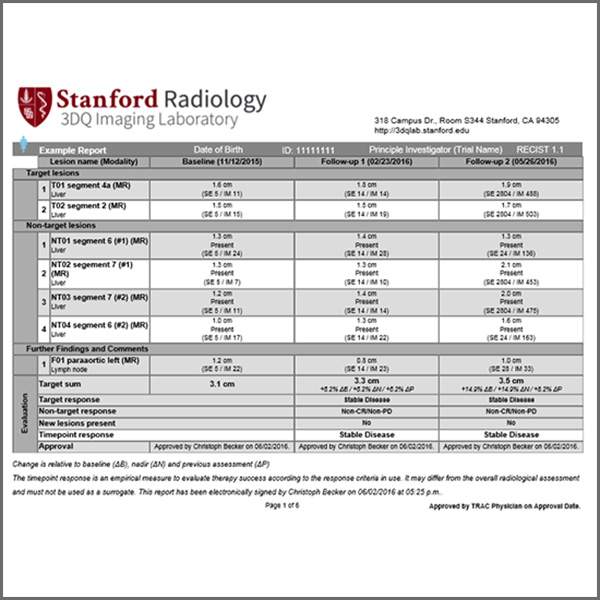
Figure B. TRAC report table summarizing baseline and follow-up measurements for target lesions, non-target findings, and overall response assessment using the selected response criteria.
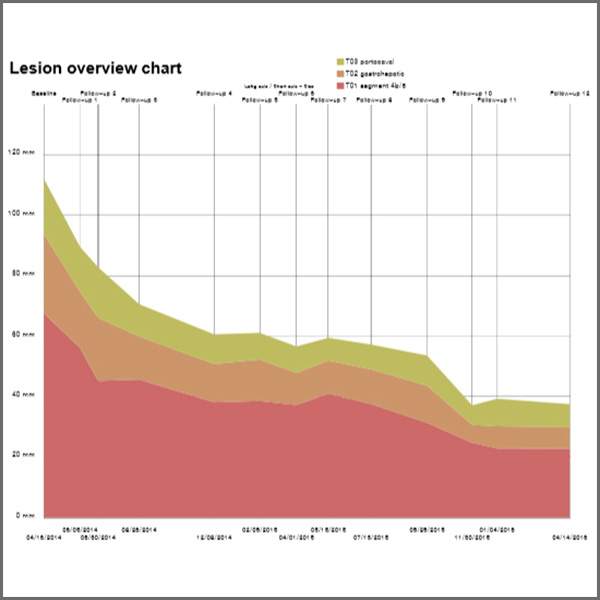
Figure C. TRAC lesion overview chart displaying longitudinal change in lesion size across multiple follow-up examinations, with stacked contributions from individual lesions over time.

TRAC is the program that resulted from that effort. The Stanford 3DQ Lab performs baseline measurements for selected target lesions, documents additional non-target lesions, and repeats the same measurements on follow-up imaging, often around three months after baseline and then at subsequent intervals. The lab applies tumor response criteria appropriate to the cancer type and treatment context and assembles structured outputs, including tables, longitudinal charts, and DICOM-derived image snapshots.

TRAC reports provide a consolidated longitudinal record of measurements and response categories from baseline through follow-up. Reports are stored within the system and are available for radiologists and referring teams to review as part of ongoing treatment response documentation.

Learn more about TRAC here.

Categories

  • Head & Neck
  • Chest
  • Abdomen & Pelvis
  • Upper Extremity
  • Lower Extremity
  • Case of the Month
  • Techniques

3DQ Lab – Grant Building

300 Pasteur Drive
Stanford, CA 94305

(650) 725-8432

Directions to Grant

3DQ Lab – Clark Building

318 Campus Drive
Stanford, CA 94305

(650) 725-6862

Directions to Clark

Learn More About the Lab

  • About Us
  • Meet the Team
Search Search

Copyright © Stanford University

© Copyright - 3D and Quantitative Imaging Laboratory - Enfold Theme by Kriesi
  • Link to LinkedIn
  • Link to Instagram
Link to: CVS Clinic Link to: CVS Clinic CVS Clinic Link to: Essential Tremor Tract Mapping Link to: Essential Tremor Tract Mapping Essential Tremor Tract Mapping
Scroll to top Scroll to top Scroll to top