3D and Quantitative Imaging Laboratory
  • Home
  • Education
    • Education
    • Educational Post Feed
  • Research
    • Research
    • Validation Cohort: Acute Uncomplicated Type-B Aortic Dissection
  • Patient Care
    • Patient Care
    • 3D Printing in Medicine
    • 3DQ Lab TRAC Team (Tumor Response)
  • Case Studies
    • Case Studies
    • Innovation Projects
  • Click to open the search input field Click to open the search input field Search
  • Menu Menu

Automated Stroke Analysis

A stroke is a medical emergency that requires immediate attention, and is currently the 5th leading cause of death in the US. A stroke occurs when there is disruption in the blood supply to the brain in the form of a blockage or ruptured blood vessel. “Time is brain” is a phrase used in the medical community that emphasizes the importance of a timely response when treating a stroke. Every moment a stroke goes untreated, the lack of blood flow to the brain can cause brain cells to die, leading to brain damage, permanent disability, or death. If treated quickly however, the effects of a stroke can be minimized or reversed.

If a patient is suspected of having a stroke, there are multiple techniques that can be automated by artificial intelligence to review scan data and quickly generate a report demonstrating brain function. The results can be distributed to the stroke team immediately, enabling quick treatment responses to mitigating permanent brain damage. These reports provide insight into identifying the type of stroke and impacted brain area which is important to identify treatment options.

Identifying the type of stroke and location in the brain is important for determining the appropriate treatment options. Below are the three types of strokes and the general treatment options available for them:

Ischemic Stroke: Occurs when a blood clot blocks a blood vessel in the brain, leading to a lack of oxygen and nutrients to the affected area. This has a wide range of symptoms such as difficulty speaking, weakness or numbness on one side of the body, or vision problems.

Common treatments for ischemic stroke include the use of intravenous thrombolytic therapy, which involves dissolving the blood clot with a medication called tissue plasminogen activator (tPA). Surgery or mechanical thrombectomy may be performed, which involves removing the blood clot with a catheter guided device.

Transient Ischemic Attack (TIA): Also known as a mini-stroke, it is caused by a temporary interruption of blood flow to the brain. It can have similar symptoms to a stroke, but typically lasts only a few minutes to hours and does not cause permanent brain damage. However, a TIA is usually a warning sign of an increased stroke risk.

Treatments for TIA include anticoagulant or antiplatelet drugs or lifestyle changes such as diet and exercise. Occasionally surgery is recommended to address the underlying causes such as a blocked artery.

Hemorrhagic Stroke: Often occurs from a burst artery or bulge in one of the brain’s blood vessels (aneurysm), causing sudden bleeding in the brain. This can cause brain damage and symptoms including headache, nausea, vomiting, and loss of consciousness.

Medication can be used to control blood pressure and reduce the risk of further bleeding. If the bleeding is severe, surgery may be required to repair the damaged blood vessel. In some cases, endovascular treatments such as coiling or stenting may be used to block off the damaged blood vessel.

CT Perfusion

To generate these automatic reports, a contrast enhanced medical imaging technique called CT perfusion must be performed during the patient’s brain scan. This technique identifies the speed and volume of blood flowing through the brain over a period of time, and visualizes areas where the blood has a difficult time accessing brain tissue.

FDA cleared software allows automatic calculation of these perfusion maps after scan data is obtained. This data can be displayed as a report of images that demonstrate different perfusion parameters over time. This report helps physicians identify areas of the brain that are receiving blood slowly or not at all, generally represented visually as dark areas in the anatomy that may indicate a blockage related to a stroke. Because this report is generated automatically after a patient scan the stroke team is able to respond with treatment options quickly, potentially deterring permanent brain damage.

Figure A (Above right): Colorized map displaying perfusion rates in the brain.
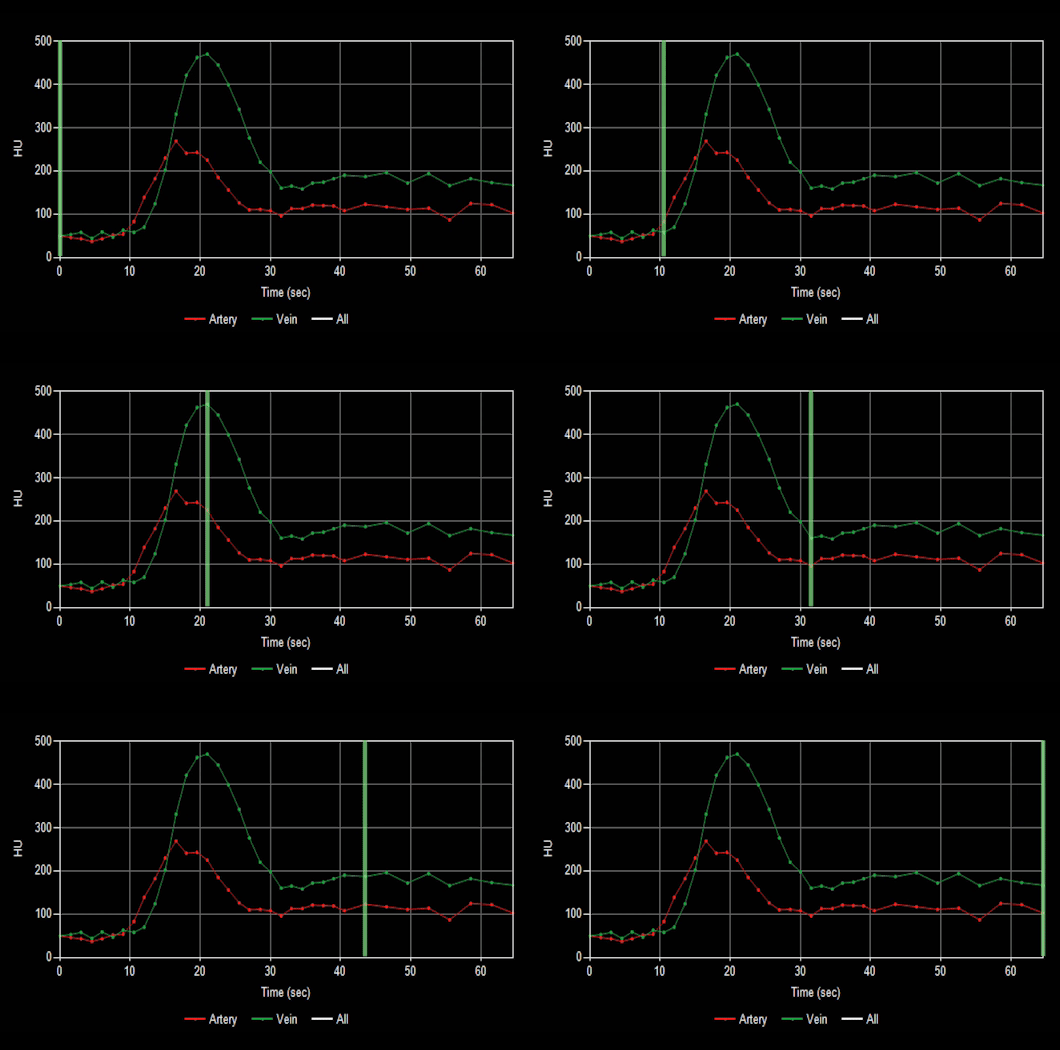
Figure B (Below left): Curve map demonstrating the change in Hounsfield intensity of arteries and veins over time.
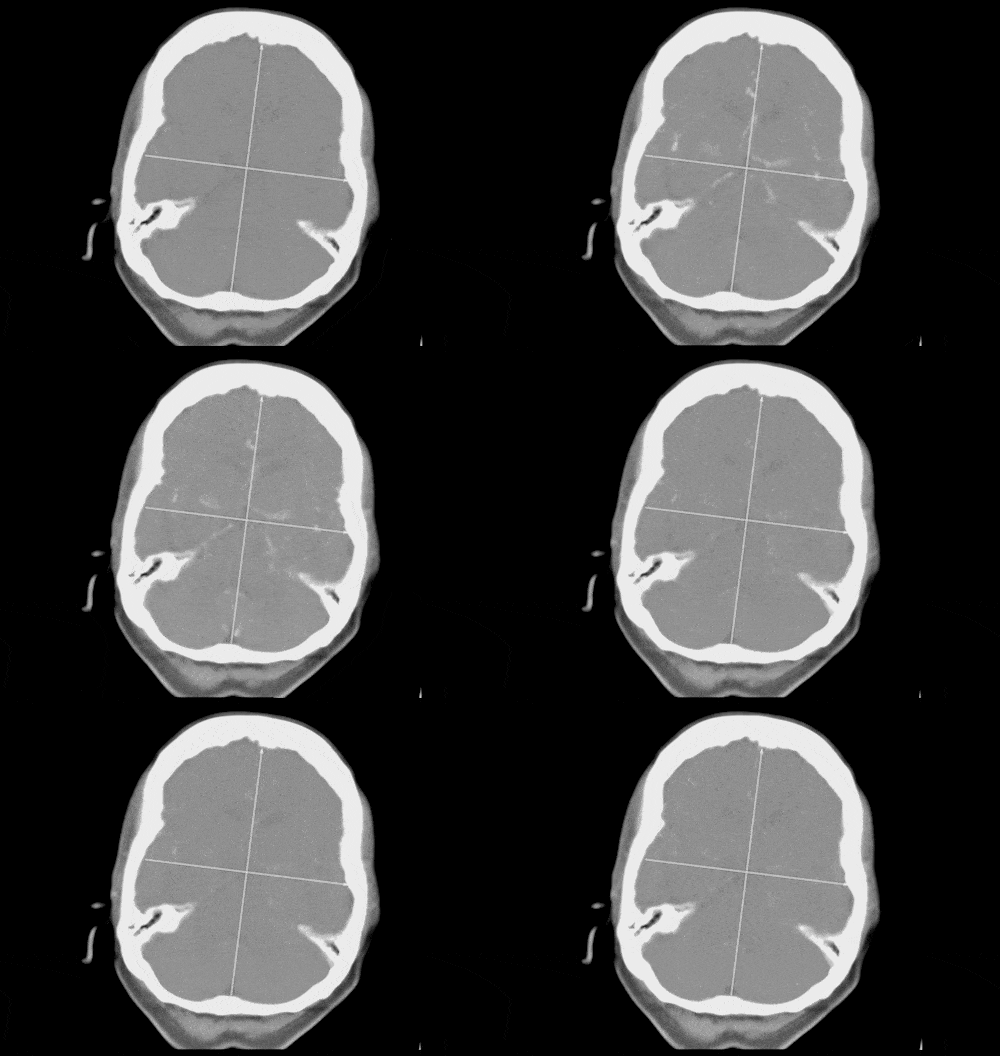
Figure C (Below right): MIP displaying contrast-enhanced blood flow moving through the brain over time.
Categories

  • Head & Neck
  • Chest
  • Abdomen & Pelvis
  • Upper Extremity
  • Lower Extremity
  • Case of the Month
  • Techniques

3DQ Lab – Grant Building

300 Pasteur Drive
Stanford, CA 94305

(650) 725-8432

Directions to Grant

3DQ Lab – Clark Building

318 Campus Drive
Stanford, CA 94305

(650) 725-6862

Directions to Clark

Learn More About the Lab

  • About Us
  • Meet the Team
Search Search

Copyright © Stanford University

© Copyright - 3D and Quantitative Imaging Laboratory - Enfold Theme by Kriesi
  • Link to LinkedIn
  • Link to Instagram
Link to: Technique of the Week – Segmentation Link to: Technique of the Week – Segmentation Technique of the Week – Segmentation Link to: 3D Printing – Paraspinal Tumor Link to: 3D Printing – Paraspinal Tumor 3D Printing – Paraspinal Tumor
Scroll to top Scroll to top Scroll to top