3D and Quantitative Imaging Laboratory
  • Home
  • Education
    • Education
    • Educational Post Feed
  • Research
    • Research
    • Validation Cohort: Acute Uncomplicated Type-B Aortic Dissection
  • Patient Care
    • Patient Care
    • 3D Printing in Medicine
    • 3DQ Lab TRAC Team (Tumor Response)
  • Case Studies
    • Case Studies
    • Innovation Projects
  • Click to open the search input field Click to open the search input field Search
  • Menu Menu

Automated Extraction of Measurements

Collaborators: TeraRecon

Many advanced imaging workflows rely on measurements created within FDA-cleared 3D imaging software scenes, such as vessel diameters, areas, and centerline-derived values. Historically, these measurements were entered manually into the 3DQ Lab’s web portal, where they could be reviewed by clinicians. While effective, this process was time-consuming and introduced opportunities for transcription errors.

Working directly with the software vendor, the 3DQ Lab identified that the scene files stored detailed XML data embedded within the DICOM header. Although this information is not directly visible to the user, it contains the measurements and scene configuration data needed to recreate how the case is displayed.

Figure A: Measurements created within FDA-cleared 3D imaging software for a cardiovascular surgery planning case.
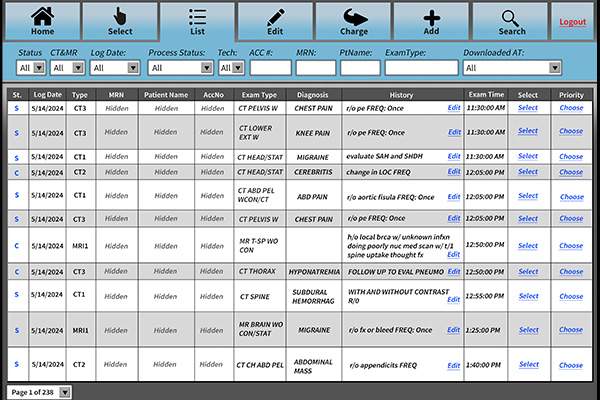
Figure B: Web portal where extracted measurements can be automatically imported.

The 3DQ Lab helped develop a workflow to automatically extract and parse this embedded XML data. Scene files were exported to a standardized location, where the XML could be unpacked and the measurements imported directly into downstream systems. This eliminated the need for manual transcription and improved the accuracy of data entered into the web portal.

Because the 3DQ Lab had archived a large number of scene files, this approach also created new opportunities for retrospective analysis. Measurements that would have been difficult to collect manually could now be retrieved in bulk and assembled into structured datasets for machine learning. This allowed values generated during routine clinical processing to be reused for AI development and other research applications.

Categories

  • Head & Neck
  • Chest
  • Abdomen & Pelvis
  • Upper Extremity
  • Lower Extremity
  • Case of the Month
  • Techniques

3DQ Lab – Grant Building

300 Pasteur Drive
Stanford, CA 94305

(650) 725-8432

Directions to Grant

3DQ Lab – Clark Building

318 Campus Drive
Stanford, CA 94305

(650) 725-6862

Directions to Clark

Learn More About the Lab

  • About Us
  • Meet the Team
Search Search

Copyright © Stanford University

© Copyright - 3D and Quantitative Imaging Laboratory - Enfold Theme by Kriesi
  • Link to LinkedIn
  • Link to Instagram
Link to: Project Baseline Imaging Link to: Project Baseline Imaging Project Baseline Imaging Link to: Aortic Surveillance Workflow Link to: Aortic Surveillance Workflow Aortic Surveillance Workflow
Scroll to top Scroll to top Scroll to top